Azure DevOps is the unofficial de-facto Continuous Integration & Deployment tool for working with Azure and the .NET stack. It’s a stable product with all the building blocks you need to deploy any type of software to the cloud.
You can use agents hosted by Microsoft or run your own to build and deploy your pipelines. Connecting to the machines running those pipelines is impossible with the hosted agents, and usually frowned upon with private agents, save a few exceptions. That means you need different debugging techniques to discover the reasons why your build or release failed to complete. Even then, it’s not always obvious what’s caused a problem.
For all of the below tips, it can be useful to run the pipeline with the system diagnostics variable set to true:

It provides an extremely verbose log output, but in desperate times, those details can point you in the right direction.
Tip #1: Reproduce It Locally or In Isolation
More frequently than I’d like to admit, a build that I’ve launched fails because I’ve forgotten to run something on my local computer first, like a unit test or linter step. That’s why the first thing I do after a failure is to reproduce the step locally. If it fails on my computer, I’ve got an easy fix on my hands. Additionally, I’ll try to run the command identically as on the build agent. For example, if it’s running unit tests with dotnet test, I’ll use the command line instead of Visual Studio to run the tests.
Some steps are difficult to reproduce locally, such as pipeline-specific tasks like creating a build number or calculating code coverage with an Azure DevOps task. In these situations, it might be easier to isolate the problem by duplicating & simplifying the pipeline down to its bare minimum tasks. It’ll save you time debugging and it’ll make it easier to eliminate other parts of the pipeline that might be at fault.
Tip #2: Look At The Pipeline’s History
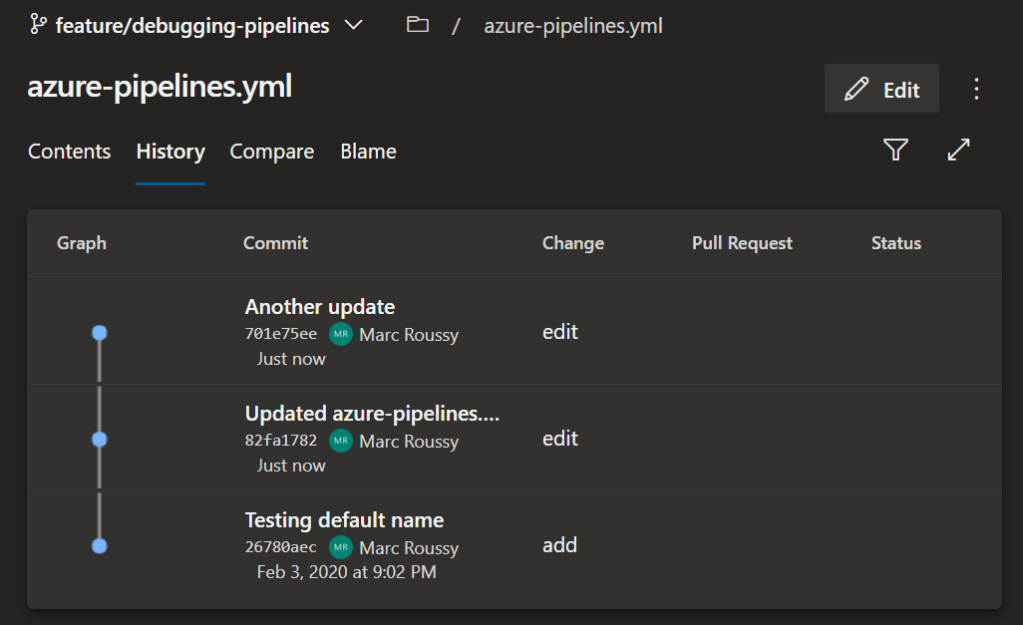
A really baffling failure will require you to take your investigative skills to the next level by digging into any changes that have been made to the pipeline. It’s easy to check the history of a YAML pipeline since it’s just another file committed to the Git repository:
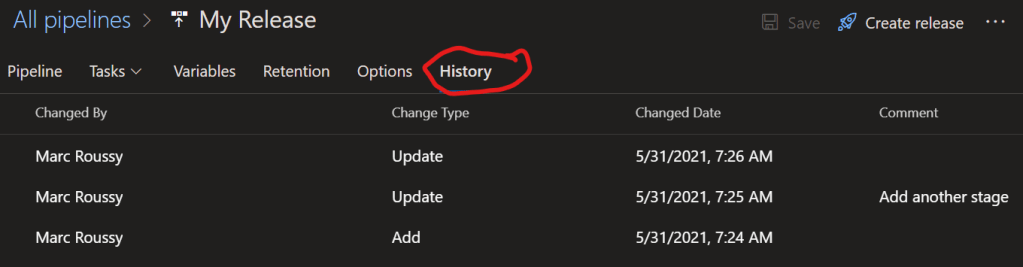
If you’re still using the visual designer for builds or releases, it’s also relatively easy to look at the history of the file by going to the History tab:
Try reverting any recent or suspicious changes to the project configuration files, which are often the culprit. For a .NET project, look at the csproj, sln and appsettings.json files; for Angular projects, you should look into the angular.json and tsconfig.json files to ensure no changes have been made.
Tip #3: Impacts from Previous Runs
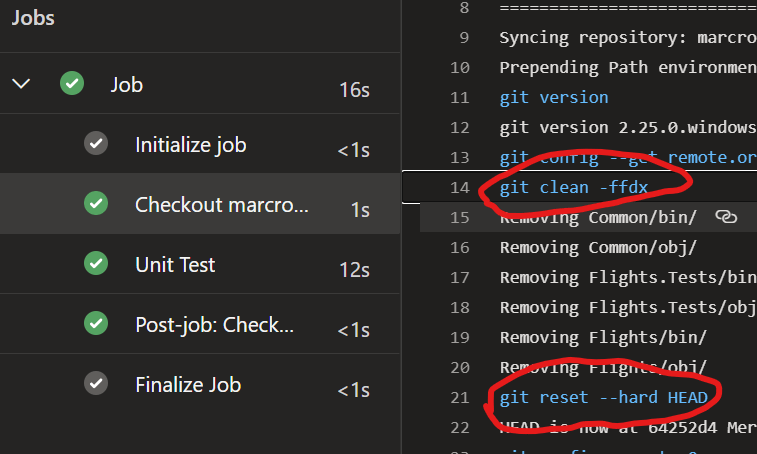
Every pipeline run should be independent of others. Even with the best of intentions, it’s possible to introduce a bug in the pipeline that’s caused by a previous run. Make sure that all checkouts of repositories are done at the beginning of the pipeline, and that they are doing a git clean of their working folder:
Tip #4: Look At A Previous, Successful Run
Sometimes the error that the build claims is causing the issue is hiding an underlying problem. That problem could be in the current build step or a previous build step. Doing a step-by-step comparison of the output of a successful and an unsuccessful run can provide you with some clues as to where and when the issue is happening. For example, you might notice the output from a successful step changed, and it might be having an effect on the following steps.
Watch out for red herrings from comparing pipeline outputs though! I’ve gone down a few rabbit holes only to find that they were completely unrelated to the problem at hand.
Tip #5: Timing issues
Another common cause of build failures is timing issues. Your build might have multiple jobs or stages that run in parallel, but that could inadvertently introduce a timing issue where two steps that actually need to run sequentially are conflicting with each other.
Similarly, build steps tend to run slower on the agent than they would if you ran them locally. For that reason, it’s important to never write tests that rely on being completed within a certain amount of time. A test that runs well locally might very well fail on the slower build server.
The Builds They are A-Changing
Unfortunately, there is no one-size-fits-all process to resolve all CICD failures. It’s definitely one of the more challenging aspects of software development and debugging, but applying the principles above should help guide you towards a solution. Do you have a secret sauce for solving Azure DevOps failures that you’d like to share? Feel free to drop it in the comments below.
