ASP.NET Core’s built-in logging mechanisms give you control over most aspects of an application’s logs, from where they are written to how they are formatted. Docker has its own log handling behaviour that integrates nicely with ASP.NET Core when running on Linux. This post explores the building blocks upon which Docker logging is built, and how it relates to ASP.NET Core’s logging.
Logging Infrastructure
Docker determines the destination for log messages via a logging driver. By default, the Docker host machine is configured to write logs to a text file, where each row is a JSON document that includes the time the event occurred and the related log message.
A text file isn’t the only destination for the logs — other logging drivers make it possible to send data to external sources. CloudWatch and GCP Logs integrate directly with their own logging drivers, while the fluentd logging driver makes it easy to integrate with popular products like Elasticsearch.

An application running in Docker has two output streams, STDOUT and STDERR, which are persisted by the configured logging driver. STDOUT and STDERR aren’t terms that I was familiar with as a .NET developer, but as it turns out that Console‘s static Write and WriteLine methods both send their output to STDOUT. And since ASP.NET Core defaults to the ConsoleLogger for its logging, it all automatically gets persisted when creating a new project.
What Happens On Each Log Message
Let’s walk through the above diagram so that we understand what’s happening:
- The application writes a log message:
_logger.LogInfo("An important message!"); - The ConsoleLogger receives the message and writes it to STDOUT.
- The default logging driver,
json-file, writes the stream to a text file on disk. The exact location depends on where you’re running the container:- Linux hosts: The log files are stored under the path
/var/lib/docker/containers/ - Windows 10 Pro with WSL1: The logs are stored in the Hyper-V virtual machine that runs your containers under the path
/var/lib/docker/containers/ - Any Windows version with WSL2 enabled: The logs are stored within the WSL2 VM, under the path
/mnt/wsl/docker-desktop-data/data/docker/containers/
- Linux hosts: The log files are stored under the path
There isn’t anything very complex going on here. In fact, the simplicity of it is quite refreshing. Now that we know how data gets logged, it’s time to figure out how to read that data when we need it.
Searching Logs
Visual Studio has an integrated view for Docker logs. You can search through the logs by hitting Ctrl-F inside the window:
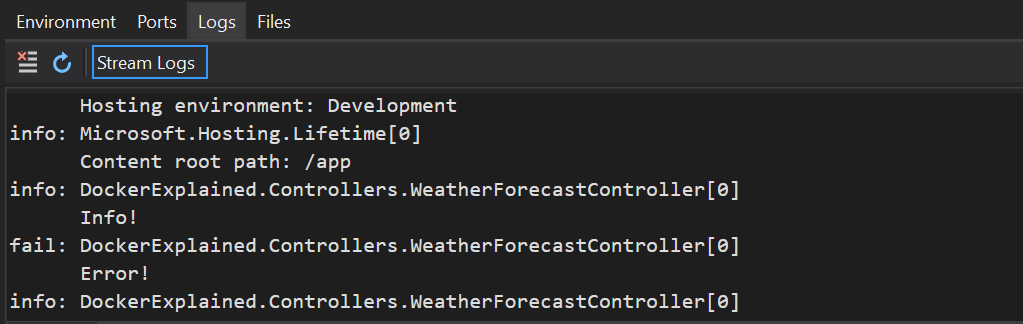
That’s fine for debugging within Visual Studio. But for a container that is running in a remote host, the best solution is to use the Docker CLI’s commands in combination with tail and grep.
The tail command can be used to see the last few log entries:
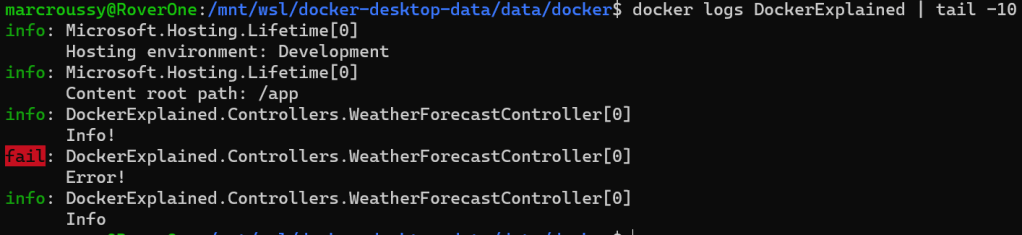
Searching for a specific message and seeing surrounding logs in an application that’s been running for awhile requires a more precise instrument like grep:

The docker logs command used above works for running and stopped containers. The logs of a stopped container are available until the container is removed from the host with the docker rm command.
Aggregating Logs
The techniques we looked at above are good enough for a standalone ASP.NET Core application. But these days, large projects often get split up into smaller projects, with many applications each running in their own container. Correlating log events that occur across those containers isn’t a simple task, and is typically when you need to consider sending all the logs to a central location.
Products like Elasticsearch, CloudWatch and Application Insights are all good fits for aggregating the logs of many containers. For containers running in Docker Swarm, the solution can be as simple as configuring a logging driver that supports these products natively or through a 3rd party like fluentd.
Similarly, containers running in a Kubernetes cluster have their own way of aggregating the logs of the pods in which they run. The most common approach is to have a logging agent that reads the logs that were written on disk and forwards them to a log aggregator. In fact, some managed K8S services like Azure’s AKS implement this pattern by reading the JSON-based logs of the container and uploading them automatically to Log Analytics.
Implementing log aggregation in this way is beyond the scope of this article, but I wanted to show that even though logging at the container level is simple, scaling to many containers poses questions that need answers.
Summary
The built-in logging mechanisms of ASP.NET Core and Docker are good enough for debugging and the most basic of applications running in a container. By default, the logs are persisted to a text file that sticks around until the container is removed from the host.
Searching the logs of an application that’s grown out to multiple ASP.NET Core projects is easier once you aggregate those separate log files into a central location, either through Docker’s logging driver infrastructure, or through the mechanisms provided by your container orchestrator. Either way, being able to easily correlate the data across services make it a worthwhile investment.

just the info i was looking for, thanks!
LikeLike
Scoped log isn’t shows up for me in container logs (AKS Linux container), Any thoughts ?
LikeLike