Visual Studio 2019 comes with some nice features to interact with Docker. One of those features is the Containers view. It lets you interact with images and containers on your machine in a basic — but useful — interface. Behind the scenes, the Containers view is running Docker commands to render the results on screen.
Visual Studio has a way of hiding the details of what’s actually going on behind the scenes of its interface. The Containers View is no different. And while it makes for a smooth developer experience, you can run into trouble when things aren’t behaving normally. This blog post deciphers the commands that Visual Studio executes to display the Container view, in the hopes of shedding some light on the magic of Visual Studio.
Containers View Overview
The Containers View is the principal element in Visual Studio to interact with Docker. Any container launched from Visual Studio or the command line appears in the view. You can start a container, stop a container, shell into a container, attach the debugger, and see all sorts of information about what’s happening inside a container’s boundaries.
A container image encloses all the components it needs to run an application, such as the operating system, relevant runtime libraries, and other dependencies. A container adds a writeable layer to the image to execute the application it was told to run. The concepts of image and container are closely linked, but since containers can’t exist without images, we’ll start by looking at the Images tab within the Containers View.
Image Commands
The example below is based on a new ASP.NET Core project with Docker support enabled in Visual Studio. During the build process, Docker downloads the images the Dockerfile relies upon (everything under mcr.microsoft.com). It then creates its own image containing the ASP.NET Core application (dockerexplained:dev). If this all sounds like jibberish, check out my previous article for a full run down of how the Dockerfile works.
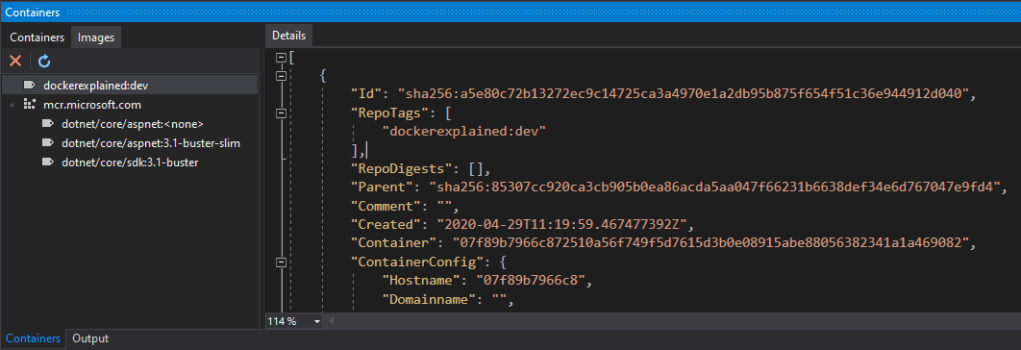
The Images tab shows all the images on the host. You can accomplish the same thing by executing the docker images list command. To display the details of each container, as shown above, run the docker image inspect <image_name> command. The details includes things like the image’s unique sha256, its parent, associated tags, and the configuration of the contianer. These details can come in useful when digging into specific problems with a container.
It’s also possible to delete an image by clicking on the red X. The equivalent docker command to perform a delete would be docker image rm <image_name>.
Container Commands
There is much more going on in the Containers tab. Every running and stopped container is displayed, making it easy to interact with any container, not just the current one being executed through Visual Studio.

Listing the containers, as shown on the left above, is accomplished with the docker ps command (the “ps” stands for process status). If you’re wondering about that weirdly named container, lucid_elion, it comes from Docker’s automatic name generation engine. The naming engine chooses two random words in its dictionnary when a container is started without specifying a name.
You can start or stop any container from the Containers view. The equivalent command lines are docker start <container-name-or-id> and docker stop <container-name-or-id>. The docker start command is for containers that have already been run and then stopped. If an image is built but was never run in a container, the docker run command must be used to execute the container.
It’s possible to attach the debugger to a running container, much like you would do with any other application running in Visual Studio. This can be useful if you started a containerized application without the debugger and run into an issue that requires step-by-step debugging. There is no equivalent Docker command for this since it’s a Visual Studio-based feature.
I need to discuss the docker exec -it command before looking at the next two features of the Containers tab. docker exec runs any supported command within the container while the -it parameters tells Docker to run the command interactively on the terminal. Combined, they allow you to perform actions on the container as if you were logged on to it.
Speaking of logging on to a container, it’s possible to do so via its operating system’s shell, with the docker exec -it <container-name-or-id> bash command. Alternatively, you can also click the terminal icon in the Containers View.
The Files tab shows you all the files inside a container. Visual Studio likely accomplishes this by recursively walking through the tree structure with the docker exec -it <container-name-or-id> ls / command.
The details of the container, such as the environment variables and networking configuration, can be retrieved with the docker inspect <container-name-or-id> command. The information is formatted more elegantly in Visual Studio, making it easier to find what you’re looking for.
It’s also relatively simple to retrieve the logs of the container with the docker logs <container-name-or-id> command. Of all the tabs within the Containers View, this is the one you’ll end up using most often since it gives you an insight into what’s happening within the running application.
More To Discover
Knowing the commands that the Containers View uses to render itself gives me a better understanding of what Visual Studio is actually doing with Docker, from the image creation process to handling the container lifecycle.
The commands reviewed in this article only scratch the surface of what’s possible with the Docker CLI. This page has a great cheat sheet of the most commonly used commands you might need beyond what’s been looked at here.

Very creativve post
LikeLike